Crude Oil Prices Sag on Inventory Build Up 07 February 2019

Oil Heads Lower On Small Inventory Build

A day after the American Petroleum Institute disappointed oil bulls by reporting an estimated inventory build across the board, the Energy Information Administration deepened the mood by saying U.S. crude oil inventories added 1.3 million barrels in the week to February 1.


At 447.2 million barrels, the EIA said, U.S. crude oil inventories are still above the seasonal average but not by much.


In gasoline, the authority reported a build of 500,000 barrels, with daily production at a little less than 9.9 million barrels. A week earlier, gasoline inventories fell by 2.2 million barrels after four weekly builds, and hefty ones, at that, with production averaging 9.9 million bpd.


Distillate fuel inventories last week shed 2.3 million barrels and production averaged 5.1 million barrels per day. A week earlier, inventories recorded a 1.1-million-barrel decline and production averaged 5 million bpd.


Crude oil prices in the meantime remain volatile although not as volatile as some expected after the announcement of the latest round of sanctions by Washington against Caracas. The worry was that the sanctions, targeting specifically PDVSA, will result in a shortage of heavy crude for U.S. refineries on the Gulf Coast, but in actuality, there seems to be sufficient spare production capacity around the world to fill any supply gap resulting from the latest developments in and around Venezuela.


It will take time for the market to factor in this fact and for now the concern about a shortage is being offset by the production cuts OPEC and Russia agreed at the end last year.


EIA’s report tends to have more influence on prices, but any effect will likely be temporary, as seen with earlier weekly inventory reports. All in all, many analysts expect the heightened oil price volatility we have been witnessing for a few months now to remain throughout 2019.


By Oilprice.com

EIA Crude Oil Inventory Report for the week ending June 22, 2018

EIA Crude Oil Inventory Report for the Week Ending June 22, 2018

U.S. crude oil refinery inputs averaged 17.8 million barrels per day during the week ending June 22, 2018, which was 115,000 barrels per day more than the previous week’s average. Refineries operated at 97.5% of their operable capacity last week.


Gasoline production increased last week, averaging 10.1 million barrels per day. Distillate fuel production decreased last week, averaging 5.4 million barrels per day.


U.S. crude oil imports averaged 8.4 million barrels per day last week, up by 114,000 barrels per day from the previous week. Over the past four weeks, crude oil imports averaged about 8.3 million barrels per day, 2.4% more than the same four-week period last year.


Total motor gasoline imports (including both finished gasoline and gasoline blending components) last week averaged 988,000 barrels per day, and distillate fuel imports averaged 54,000 barrels per day.


Source: eia.gov

U.S. Energy Information Administration report on Domestic crude-oil supplies felldown

The U.S. Energy Information Administration on Wednesday reported that domestic crude-oil supplies fell for the first time in 10 weeks. Supplies declined by 200,000 barrels for the week ended March 10.


The American Petroleum Institute late Tuesday reported a 531,000-barrel decline, while analysts polled by S&P Global Platts forecast a climb of 3.5 million barrels.


Gasoline supplies fell by 3.1 million barrels, while distillate stockpiles dropped 4.2 million barrels last week, according to the EIA. April crude CLJ7, +2.07% was up 78 cents, or 1.6%, to $48.50 a barrel on the New York Mercantile Exchange. It was trading at $48.70 before the …

American Petroleum Institute

American Petroleum Institute reported to build 11.6 million barrels

The American Petroleum Institute (API) reported a build of 11.6 million barrels in United States crude inventories against expert predictions that domestic supplies would see a much kinder 1.4-million-to 1.66-million-barrel build.


The build in crude oil inventories was almost 10 times what analysts had predicted and marks yet another new high in U.S. inventories. The chart below displays a 10-week cumulative build of 35 million barrels, per API data, since the beginning of the year.


A few hours before the API data release, WTI and Brent benchmarks were both down despite Libya’s recent production woes, which were offset by Russia’s.

U.S. Energy Information Administration - increase in domestic crude-oil supplies

U.S. Energy Information Administration reported increase in domestic crude-oil supplies

The U.S. Energy Information Administration on Wednesday reported an eighth straight weekly increase in domestic crude-oil supplies, but it was smaller than the market expected. Crude inventories rose by 1.5 million barrels for the week ended Feb. 24.


The American Petroleum Institute late Tuesday reported a 2.5 million-barrel climb, according to sources, while analysts polled by S&P Global Platts forecast a climb of 2.1 million barrels.


Gasoline supplies declined by 500,000 barrels, while distillate stockpiles fell 900,000 barrels last week, according to the EIA. April crude.

Energy Information Administration

The Energy Information Administration sunk oil markets deeper into despair reporting a build of 13.8 million barrels for commercial crude oil inventories in the U.S. Total commercial inventories are at 508.6 million barrels, above the upper limit for the season.

A day earlier, the American Petroleum Institute reported the second-largest weekly inventory build ever in the history of records, at 14.227 million barrels, versus expectations of a 2.38-million-barrel increase.

Last week, both EIA and API reported substantial builds in inventories, with the EIA figure at 6.5 million barrels for the week to January 27, exceeding API’s. 

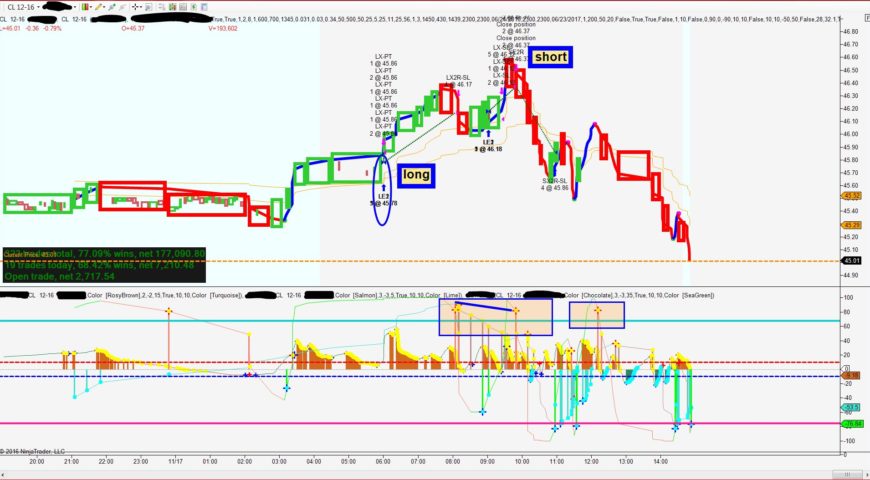
Brick Strategy , NINJA TRADER, technical Analysis, Forex trading stratgies, Forex Trade Indicator, rsi, emini, ninja trading, , best Forex Indicator, Swing Trading, day trading strategies,  trade ninja, day trading, candlestick Chart, Ninja Trading Platform

U.S. Yields Lower

Treasuries have already priced in a rate hike and more, with 10-year yields pulling back from peaks seen earlier this week just above 2.5 per cent.

In contrast to the Fed, the European Central Bank only last week extended its asset-buying campaign and moved to purchase more short-term debt.

As a result, the spread between U.S. and German two-year yields is at its widest since late 2005, with Treasuries offering a mouth-watering premium of 191 basis points.

Speculation that a Trump administration will implement more debt-financed fiscal stimulus and cut regulation helped all three major U.S. stock indexes to record highs this week. The Dow ended fewer than 100 points from the 20,000 mark.

Bank of America Merrill Lynch’s latest survey of investors found expectations of global growth at 19-month highs and inflation at the second highest percentage in 12 years.

Fund managers were their most optimistic about corporate profits in more than six years and allocations to bank stocks surged to an all-time peak.

Bulk commodities from iron ore to coal have also benefited from the reflation trade, combined with signs of stronger growth in China. Again, any hint the Fed might step up the pace of tightening could undo some of those gains.

Oil ran into profit-taking following a reported rise in U.S. crude inventories and an estimate that OPEC may have produced more crude in November than previously thought.

U.S. crude futures, which hit a high of $53.41 on Tuesday, were down 60 cents at $52.38 a barrel. Brent crude eased 23 cents to $55.20.


Open