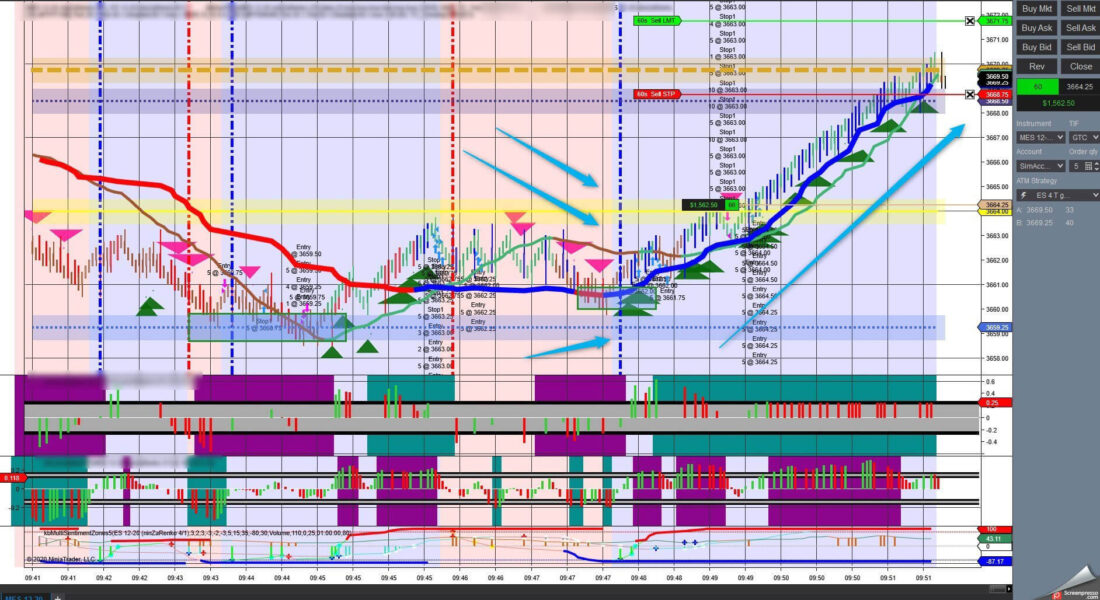
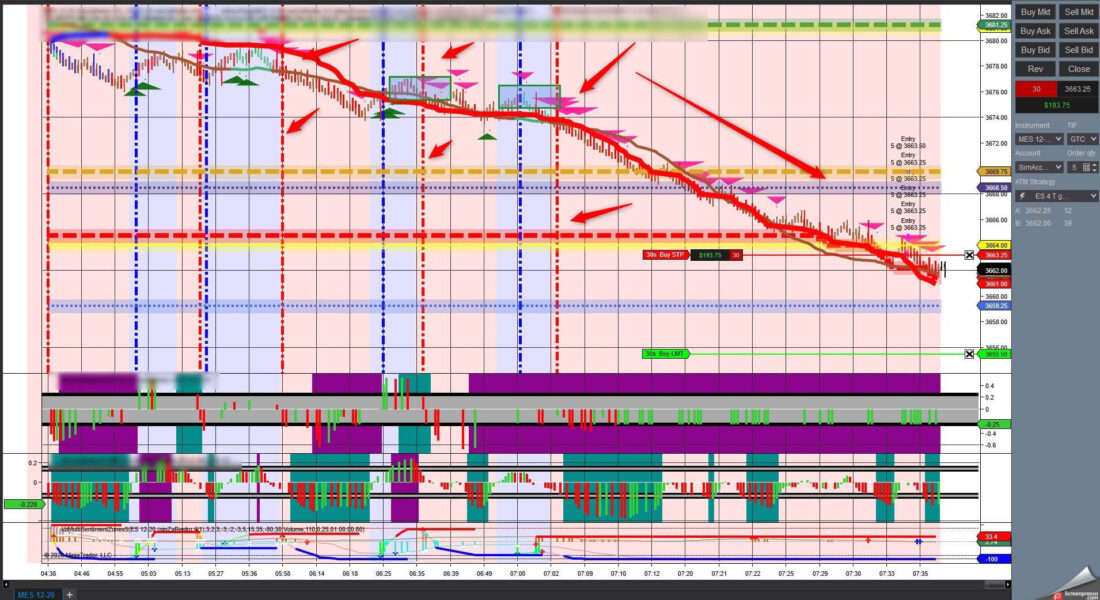
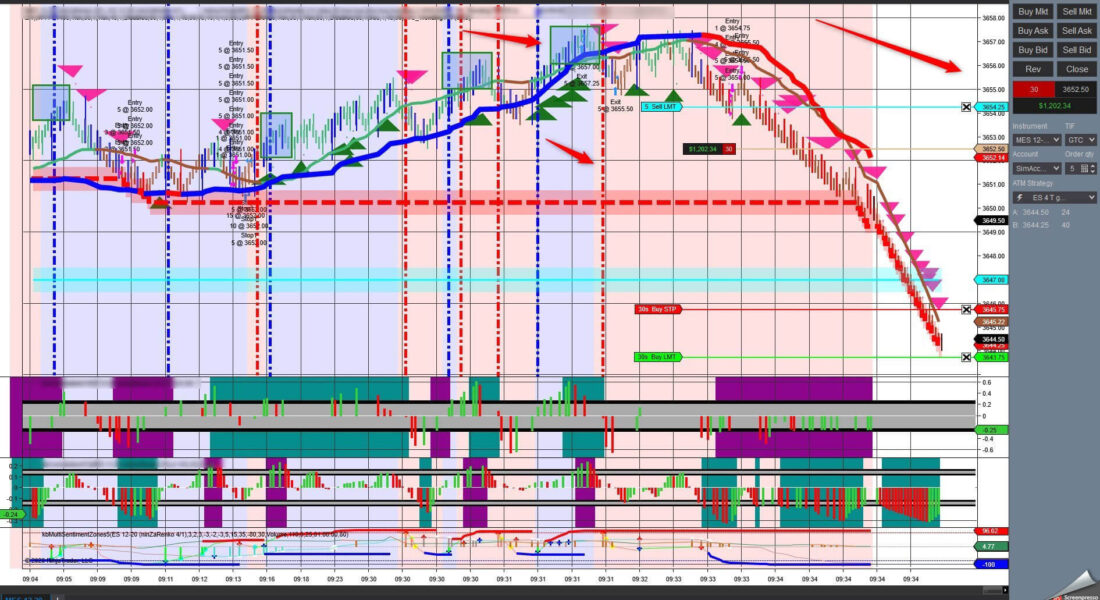
The Multi Sentiment Zones 5.0 indicator is an advanced multi-data sentiment indicator that shows clear zones of overbuy and oversell using hyphenated vertical blue and red lines on your trading cart. The indicator will also overlay color onto zones to indicate the duration that any particular asset has been in overbuy or oversell status.
This gives you a clear visualization of when and where sentiment has developed, continued or changed through multiple data levels.
Volume data, support and resistance levels and sentiment are all important principles in trading.
Is the asset thinly traded?
What is the liquidity of the asset?
Is stock volume rising or slowing?
What is the current resistance level of the asset?
Is the current price near the support level or close to resistance levels?
How is sentiment likely to affect the assets price, margins, movement?
You don’t have to assess any of these principles on your own, using up your valuable time. The Volume Trend Originator will do all of that for you and give you a clear, visual indicator to let you decide when it’s time to move on an asset.
The Multi Sentiment Zones 5.0 Indicator is a great addition to NINJA TRADER on its own or in combination with other indicators to make reading any market very much like reading traffic signs on your way to work.
Buy Multi Sentiment Indicator $1599.00
$1,599.00Add to cart
Click Image To Enlarge


